The usage of AIS data in research on maritime traffic topics is heavily dependent on three factors: the reliability, availability, and ease of use of the data. To directly address these issues and offer a solution to them, a platform for maritime traffic analysis is developed. The platform’s main body is built with Python and SQL languages, allowing for exceptionally large amounts of data to be stored and retrieved with ease. Several tools and software libraries that have been developed for data decoding, handling, processing, and visualisation as open-source libraries for Python are adopted in the development of the platform.
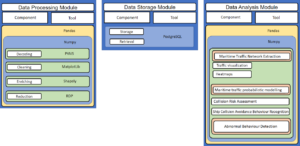
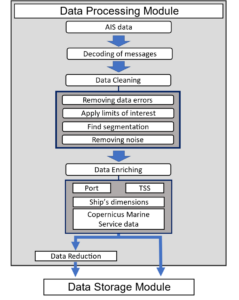
The developed maritime traffic analysis platform consists of three main modules which are subdivided into components that are developed to address more specific issues using available tools and software libraries (Figure 1):
- Data Processing module unites every component directly related to the decoding and treatment of the raw AIS data. Several different methods of data handling and processing are applied in this module to simplify the development of the two other modules.
- Data Storage module handles the interactions with the database, facilitating the storage and retrieval of data from the platform.
- Data Analysis module includes several methods of analysis, such as visual, using maps and graphs, or statistical, such as the analysis of historic data of an area.
The open-source library Pandas which provides high-performance, easy-to-use data structures and data analysis tools for the Python programming language is used to facilitate data handling. Several operations are carried out using the NumPy library and the images are created using Matplotlib. The PYAIS library is used to decode the raw messages, and the RDP library is used to compress the ship trajectories using the Douglas-Peucker algorithm. The storage is handled with PostgreSQL, an open-source object-relational database. This database has good integration with Python, allowing for a smooth and predictable joint operation between the Python code and the database.
The core of the developed platform is to process “raw” AIS messages into useful and reliable information for several applications. For this purpose, the following four main steps should be properly taken (Figure 2):
- Decoding;
- Cleaning;
- Enriching;
- Reducing.
AIS messages are transmitted in an encoded format and must be decoded to be interpreted. The integrity of all AIS messages can be verified using a checksum that is found at the end of each message. However, it is possible to find messages with correct checksums, but wrong bit lengths for the specified message type. In addition, several other errors may be found in AIS data, resulting from poor human input, incorrect installation or faulty sensors.
External sources are used to add static information about ports and TSS (Traffic Separation Scheme) locations, as well as adding historical data regarding weather and sea conditions along the ship trajectories.
An adequate characterisation of the locations of ports and their terminals is important as they define the origin- destination of ship trajectories that follow the same itinerary. The grouping of these trajectories enables the construction of a route normalcy model that can be used for anomaly detection. A maritime traffic network can then be established by applying the process to all ports. A similar process is made with the TSSs along the coast of Portugal. There are three of these schemes near the continental coast of Portugal: one near Cape Roca, one near Cape S. Vincent and one near Finisterre, in Spain. These have great importance to the organisation and flow of maritime traffic in Portugal. The entries in the trajectory’s dataset are checked to find if they are inside the area of one TSS and, if they are, which lane are they in, based on IMO’s publication Ship’s Routeing.
An important data enrichment implemented in the maritime traffic platform is the reconstruction of the sea and weather conditions along the ship trajectories using the Copernicus Climate Data [1], [2], [3]. The weather and sea conditions can have a direct impact on maritime operations and consequently on their safety. These impacts can be caused by isolated climate events or may have a long-lasting influence on maritime traffic in a specific area. For example, if possible, areas with either momentaneous or persistent occurrences of strong winds and high waves tend to be avoided by vessels during voyage planning. The analysis of historical AIS data and the development of probabilistic models for trajectory prediction, collision risk assessment and abnormal detection benefit to a large extent from this type of information. The sea and weather conditions can be obtained for a specific location and time to reconstruct the conditions along a historical trajectory or statistically in a given route (see Figure 3).
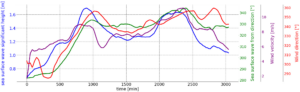
The data from the Copernicus programme, the European Union’s Earth Observation Programme, is used in this platform. The Copernicus programme provides a wide range of data products that can be merged with the AIS data for maritime traffic analyses. Each data product consists of several variables, evaluated at specific latitude and longitude points. Each data product has its update frequency, usually daily or hourly updates. The data provided is sourced either from the observations made with the several satellites used by the Copernicus programme or as a reanalysis based on several other data sources and prediction models.
Three data products available via the E.U. Copernicus Marine Service Information are added to the platform’s database to explore this capability, namely:
- Global Ocean Hourly Reprocessed Sea Surface Wind and Stress from Scatterometer and Model [1];
- Atlantic – Iberian Biscay Irish – Ocean Physics Reanalysis [2];
- Atlantic – Iberian Biscay Irish – Ocean Wave Reanalysis [3].
The method consists of evaluating the climate variable, for example, the wave significant height, in a specific geographical location and time along the ship trajectory. This is achieved by interpolating the Copernicus data stored in the platform’s database. This interpolation uses the latitude, longitude and time of the report as input, and the Copernicus’ data as source for the variable’s characterisation in pre-determined locations and specific times. This method is applied on demand during an analysis rather than to the complete dataset due to the number of variables and datasets available. Other data-enriching options are possible from the vast quantity and variety of the Copernicus programme’s data products. These can be implemented based on the needs of different analyses.
The Data Storage Module holds every component related to the permanent storage and access of the data. The objective of this module is to provide an easy way to store and retrieve the data for post-processing. A very desirable feature of a storage system is to have efficient tools that can facilitate the retrieval of data. For this purpose, a SQL server made with PostgreSQL is used as a storage solution in the platform. The interaction with the database is made using queries, these are commands written using the proper language to perform operations with the server.
The structure created for the platform contains seven tables. These are created in the PostgreSQL interface using queries. The two main ones are the maritime traffic tables. One is made for the full uncompressed data and another for the data that has gone through the process of reduction. A “Ships” table is used to store all the static and voyage-related messages. The tables ” TSS” and “Ports” contain the coordinates used in the data processing to evaluate the presence of each vessel in either a TSS or port area. A table “types of ships” is used to store information on the types of vessels identified in the AIS documentation. Finally, the data from the E.U. Copernicus Marine Service Information is added to a table, organised by date and variable.
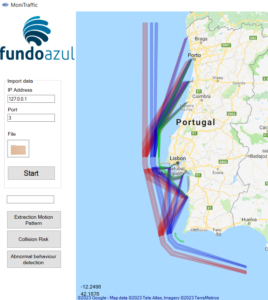
The maritime traffic analysis module includes three main computational tools that have been implemented in C# (C-Sharp) programming language under the scope of the project MoniTraffic:
- Maritime traffic pattern extraction;
- Maritime traffic probabilistic modelling;
- Detection and classification of abnormal ship behaviour.
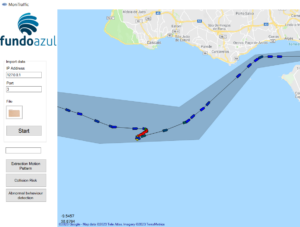
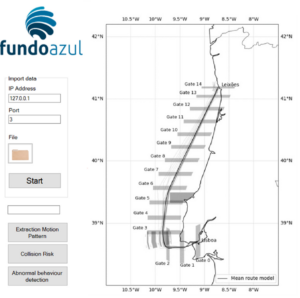
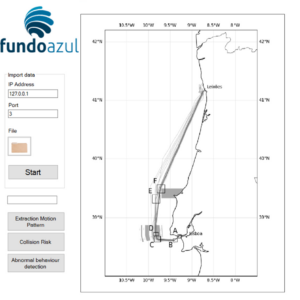
The interface of the platform prototype is shown in Figure 4. Each function requires historical AIS data to be imported first, the user can simply click the “File” button and select the AIS data file or input IP Address to connect database. Once the AIS data is imported correctly, then the user can execute the three functions by click the corresponding buttons.
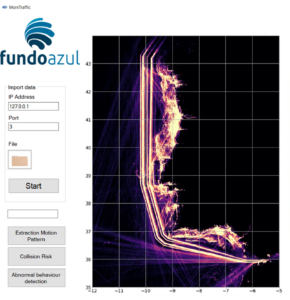
When analysing the ship trajectories over a period of time, the general motion patterns of ship trajectories that follow a similar route are learned using clustering techniques. As shown in Figure 5, the main motion patterns are determined based on the analysis of AIS data. The computational tool starts from identifying origin-destination areas (represented by grey polygons) in the study area based on the DBSCAN algorithm. Then, the ship trajectories that follow the same itinerary, e.g., from an origin area to a destination area, are grouped together. The route centreline and route boundaries (represented by red, blue and green polygon in Figure 5 are estimated by statistical analysis of ship trajectories within the ship route based on DTW algorithm.
- the mean route and its boundary;
- lateral distance distribution (LD) along the route;
- distributions of SOG along the route;
- probability intervals of LD and SOG along the route (90% probability intervals);
- the turning areas;
- vessel behaviour in the turning areas.
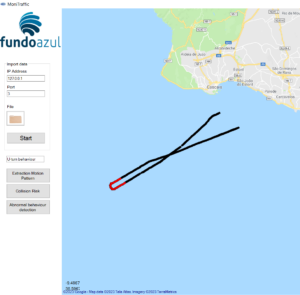
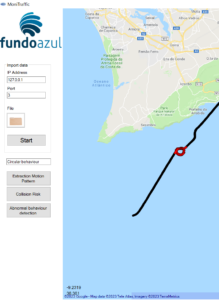
A data-driven method for ship abnormal behaviour detection and classification in ship trajectories provided by AIS data detection is proposed and implemented.
The approach is derived from a maritime traffic normalcy model that is constructed based on historical ship trajectories provided by Automatic Identification System data. First, an improved Sliding Window algorithm is suggested to detect the ship abnormal behaviours. Then, patterns of motion features extracted from the ship abnormal behaviours are identified using a density-based clustering method. Finally, a Random Forest Classification model is trained based on the extracted features from the clusters for real-time ship abnormal behaviour classification.
The off-route behaviour, unexpected speed and heading not compatible with the route can be effectively detected in a probabilistic manner. The ship abnormal behaviours are further characterised using features, including standard deviation of speed, detour factor, drifting angle, accumulative COG change, delta COG, and maximum lateral distance, and identified four clusters representing typical abnormal behaviours.
In addition, SHAP (SHapley Additive exPlanations) values is employed to further evaluate how the features contribute to the classification. It is found that the features accumulative COG, delta COG, detour factor, and maximum lateral distance had the most significant contributions to Class 1 (Circular), Class 2 (U-turn), Class 3 (Double U-turn) and Class 4 (Off-route), respectively (see Figure 8 to Figure 10). The analysis also reveals that higher values of certain features can have a positive impact on some classes while having a negative impact on others. The feature of maximum lateral distance is particularly dominant in predicting Class 4 (Off-route) with higher values showing a significant effect on the prediction.
Finally, the developed classification model is applied to a test ship trajectory, where it successfully classified the behaviour into distinct classes according to the observed features of the ship motion behaviour.