A maritime traffic route extraction and modelling method based on historical AIS data is proposed to identify and understand the maritime traffic patterns. The extraction of maritime traffic routes consists of grouping ship trajectories that follow the same itinerary, e.g., from traffic origin areas to destination areas. The ship static positions and enter/exit points are clustered using the OPTICS algorithm. Differently from centroid-based clustering, the OPTICS algorithm does not require the number of clusters to be defined in advance. Instead, arbitrarily shaped clusters can be determined as often observed in maritime traffic context. Once the clusters are learned, individual ship trajectories are grouped into traffic-groups, which are defined as sets of ship trajectories corresponding to different departure or arrival areas. In this study, 68 traffic-groups are detected, as shown in Figure 1.
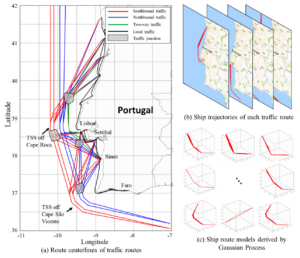
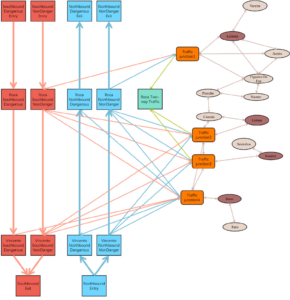
By taking the traffic origin-destination areas as nodes and the extracted ship routes as edges, a maritime traffic abstraction network model is formed. Maritime domain knowledge can add semantic information to the maritime traffic abstraction model and enhance the interpretation of ship movements, which potentially can improve the maritime traffic management. The geographical domain knowledge comes in the form of two simple ontologies. One ontology has definitions of the ports of Portugal, the polygons and names that define the different ports follow the GeoNames ontology. The other ontology consists of the Traffic Separation Schemes (TSS) off the Portuguese coast, off Cape Roca and off Cape San Vincent. The resulting maritime traffic abstraction of the study area can be represented by the network model shown in Figure 2.
- Definition of traffic patterns by grouping ship trajectories according to final destinations;
- Waypoints and route legs identification;
- Probabilistic characterization of ship trajectory at waypoints and route legs.
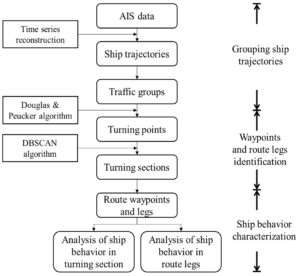
A shipping route is assumed as a set of straight segments or legs connecting waypoints, corresponding to locations of significant changes in the navigational behaviour of the ships such as changes in heading or velocity, which allows a compact representation of ships’ motion.
A route turning section is automatically identified by clustering turning points detected in ship trajectories. A turning point in a ship trajectory is where a significant directional change in the ship trajectory is observed. The Douglas-Peucker (DP) algorithm typically used for ship trajectory compression can also be used for turning point detection. DBSCAN algorithm is applied for turning points clustering in this study. This algorithm forms clusters of elements based on the density of points in their neighbourhood.
The turning points detected along the ship routes passing the TTS off Cape Roca to the three ports are shown in Figure 4 (black points). Then, turning sections are identified by the spatial distribution of the coordinates of the turning points detected.
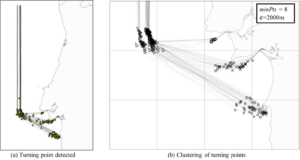
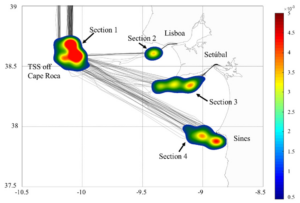
Figure 5 shows the spatial density distribution of the turning points. The study area is discretised in a 600*500 grid and the spatial density distribution of the turning points at each cell is calculated using the KDE method and depicted using the RGB (Red Green Blue) colour code. Once the density value of each grid cell is calculated, the colours of the grids are determined according to the corresponding turning points.
A statistical analysis is performed to study the maritime traffic on the route passing southbound dangerous traffic lane to Port of Sines, as tanker is the main ship type in this route. As shown in Figure 6, the ship route that passes the Southbound dangerous traffic lane to Port of Sines is divided by two turning sections derived above. In Leg 1 ships move southward toward the TSS off Cape Roca’s Southbound dangerous traffic lane. Then, in Turning Section 1 ships turn east toward Sines Port in Leg 2.
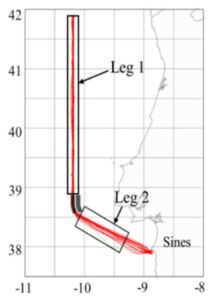
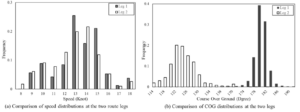
Figure 7 illustrates the speed and COG distributions of ships in the two legs. In terms of speed distributions, it is seen that most ships in this route sail at 12-15 knots (70.9 % in Leg 1 and 66.2% in Leg 2, respectively). Figure 7(b) shows COG distributions at each leg. Obviously, there are significant differences between the traffic in each leg. One may notice two peaks in the histogram of COG, which correspond to the two directions of the legs.
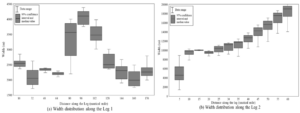
It is found that route width changes along the route. This indicates that the lateral distribution along the waterway needs to be investigated. The route width is estimated according to trajectory spatial distribution along the ship route. Once the route centreline is derived, the lateral distributions along legs 1 and 2 are calculated from the available AIS data at every 16 and 5 nautical miles (NM), respectively, as shown in Figure 8. The leg lateral distribution is approximated by a normal distribution, and then the 95% probability interval of the distribution is adopted as the route width. The grey box indicates the 95% confidence interval estimated by the series of route widths in a given section.